Bringing humans into the loop in Automated Scoring
Published:
Making a case for bringing humans into the loop to make Automated Scoring Systems cheaper and more reliable
Introduction
Automated Scoring is the task of scoring unstructured responses to open-ended questions, such as essays or speeches. Automated Scoring systems are behind all the popular language proficiency tests of today such as ETS’ TOEFL or Duolingo’s DET. These systems have come a long way since their initial iteration by Ellis Page way back in 1967. What makes Automated Scoring Systems attractive?
- Low costs - A model is inherently scalable and can score perhaps hundreds of essays in the time it takes a (costly) human rater to score one.
- Uniform scoring - Automated Scoring Systems can apply grading rubrics uniformly across responses, without being disrupted by human concepts like ‘breaks’. While model bias and interpretability are actively researched topics and far from solved, the promise of uniform scoring remains.
These factors among others have fueled the popularity of AS systems, commanding a market of 110 billion (!) USD, and being adopted even by governmental institutions.
 Your teacher is incredibly happy with your essay, though it may be hard for you to tell. Source : NCIEA
Nevertheless, the meteoric rise has not been without criticism. One of the most damning criticisms comes from Perelman’s aptly named The Basic Automatic B.S. Essay Language Generator which achieved perfect scores on ETS’ system with gibberish prose. There’s a long way to go, but the advantages are undeniable, making it an important research area.
Current AS systems are of two varieties:
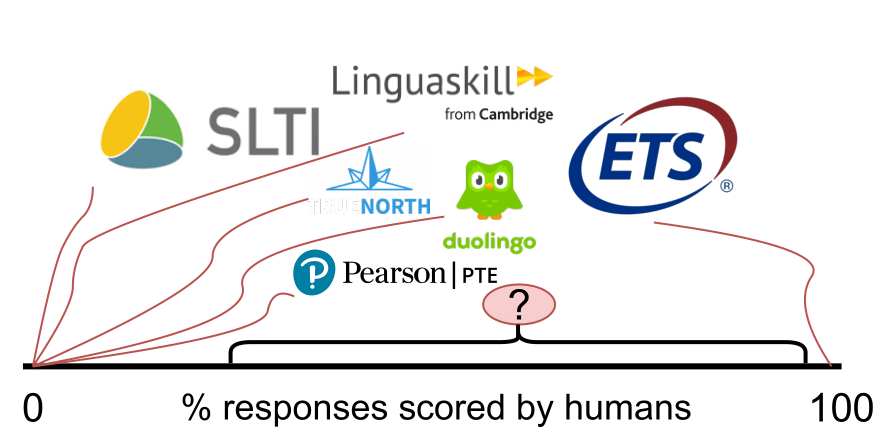
- Double Scoring - The TOEFL exam scores every response by both a human and an AS system with a second human rater to resolve disagreements. This means that there is atleast one human rater per response, which can be seen from the TOEFL’s high price.
- Machine-only Scoring: On the other hand lie tests like the Duolingo English Test (DET), scored completely automatically. reducing costs but also reducing the reliability of the test. Of course, DET costs only 49 USD, less than one-fourth of what the TOEFL costs!
 All the tests shown in the figure except Pearson PTE are priced around the same.
Now, we’re faced with two problems:
- How do we make Automated Scoring Systems more reliable? (Bring expert human scorers in, of course. They can correct the system when it’s wrong.)
- How do we make Automated Scoring Systems more accessible i.e. cheaper? (Get rid of the humans, of course. We won’t have to deal with pesky things like raises and inflation.)
This is the exact problem we tackle in Using Sampling to Estimate and Improve Performance of Automated Scoring Systems with Guarantees , our recent paper which has been accepted at the Twelfth AAAI Symposium on Educational Advances in Artifical Intelligence (EAAI-22), held in conjunction with AAAI-22. Congratulations to my co-authors Yaman Kumar Singla, Dr. Rajiv Ratn Shah from the MIDAS Lab at IIIT-Delhi and Dr. Changyou Chen from the University at Buffalo, State University of New York!
Existing systems go all-or-nothing with humans, and we attempt to get the best of both worlds using sampling techniques. In summary, our contributions are as follows:
- Combine existing paradigms to integrate humans with Automated Scoring Systems partially by using humans to score some, but not all, of a given set of responses.
- We conduct experiments on various models deployed in real world AS systems, and we observe significant gains in accuracy using our proposed model, Reward Sampling.
- Improving the system’s performance is a noble goal, but arguably more important is its reliability i.e. if it can perform well consistently. Thus, we also propose an algorithm to estimate the performance of the system with statistical guarantees.
This post presents a high level overview of our contributions. Do read the paper for more detail!
How do we bring humans into the picture?
So, we want to bring in the experts and make them fix the system’s mistakes. Let’s assume we can have 20% of our responses scored by humans, or to paraphrase, we have a budget of 20%. How do we choose which 20% of responses we want the humans to grade? The baseline approach is of course, random sampling. Randomly select 20% of our responses and send them off to the human raters. However, this does not work too well. In fact, it worsens the better our model is.
Let’s take an example model, that can correctly grade 800/1000 essays (80% accuracy). And we have a budget of 20%, or 200 essays. In an ideal world, we would be able to identify which 200 essays the model would get wrong and get them scored by experts. This would give us an absolute gain of 20%, and boost us all the way to 100% accuracy. Now, where we do get with random sampling? 80% of the selected 200 responses would have been gotten right by the model anyway leaving us with only $ 0.2*200 = 40 $ useful samples, an increase of only 4% in accuracy. Clearly, random sampling makes poor use of our human raters.
In search of better sampling techniques
Our problem is straightforward: How do we find where our model is likely to assign the wrong score?
Uncertainty Sampling
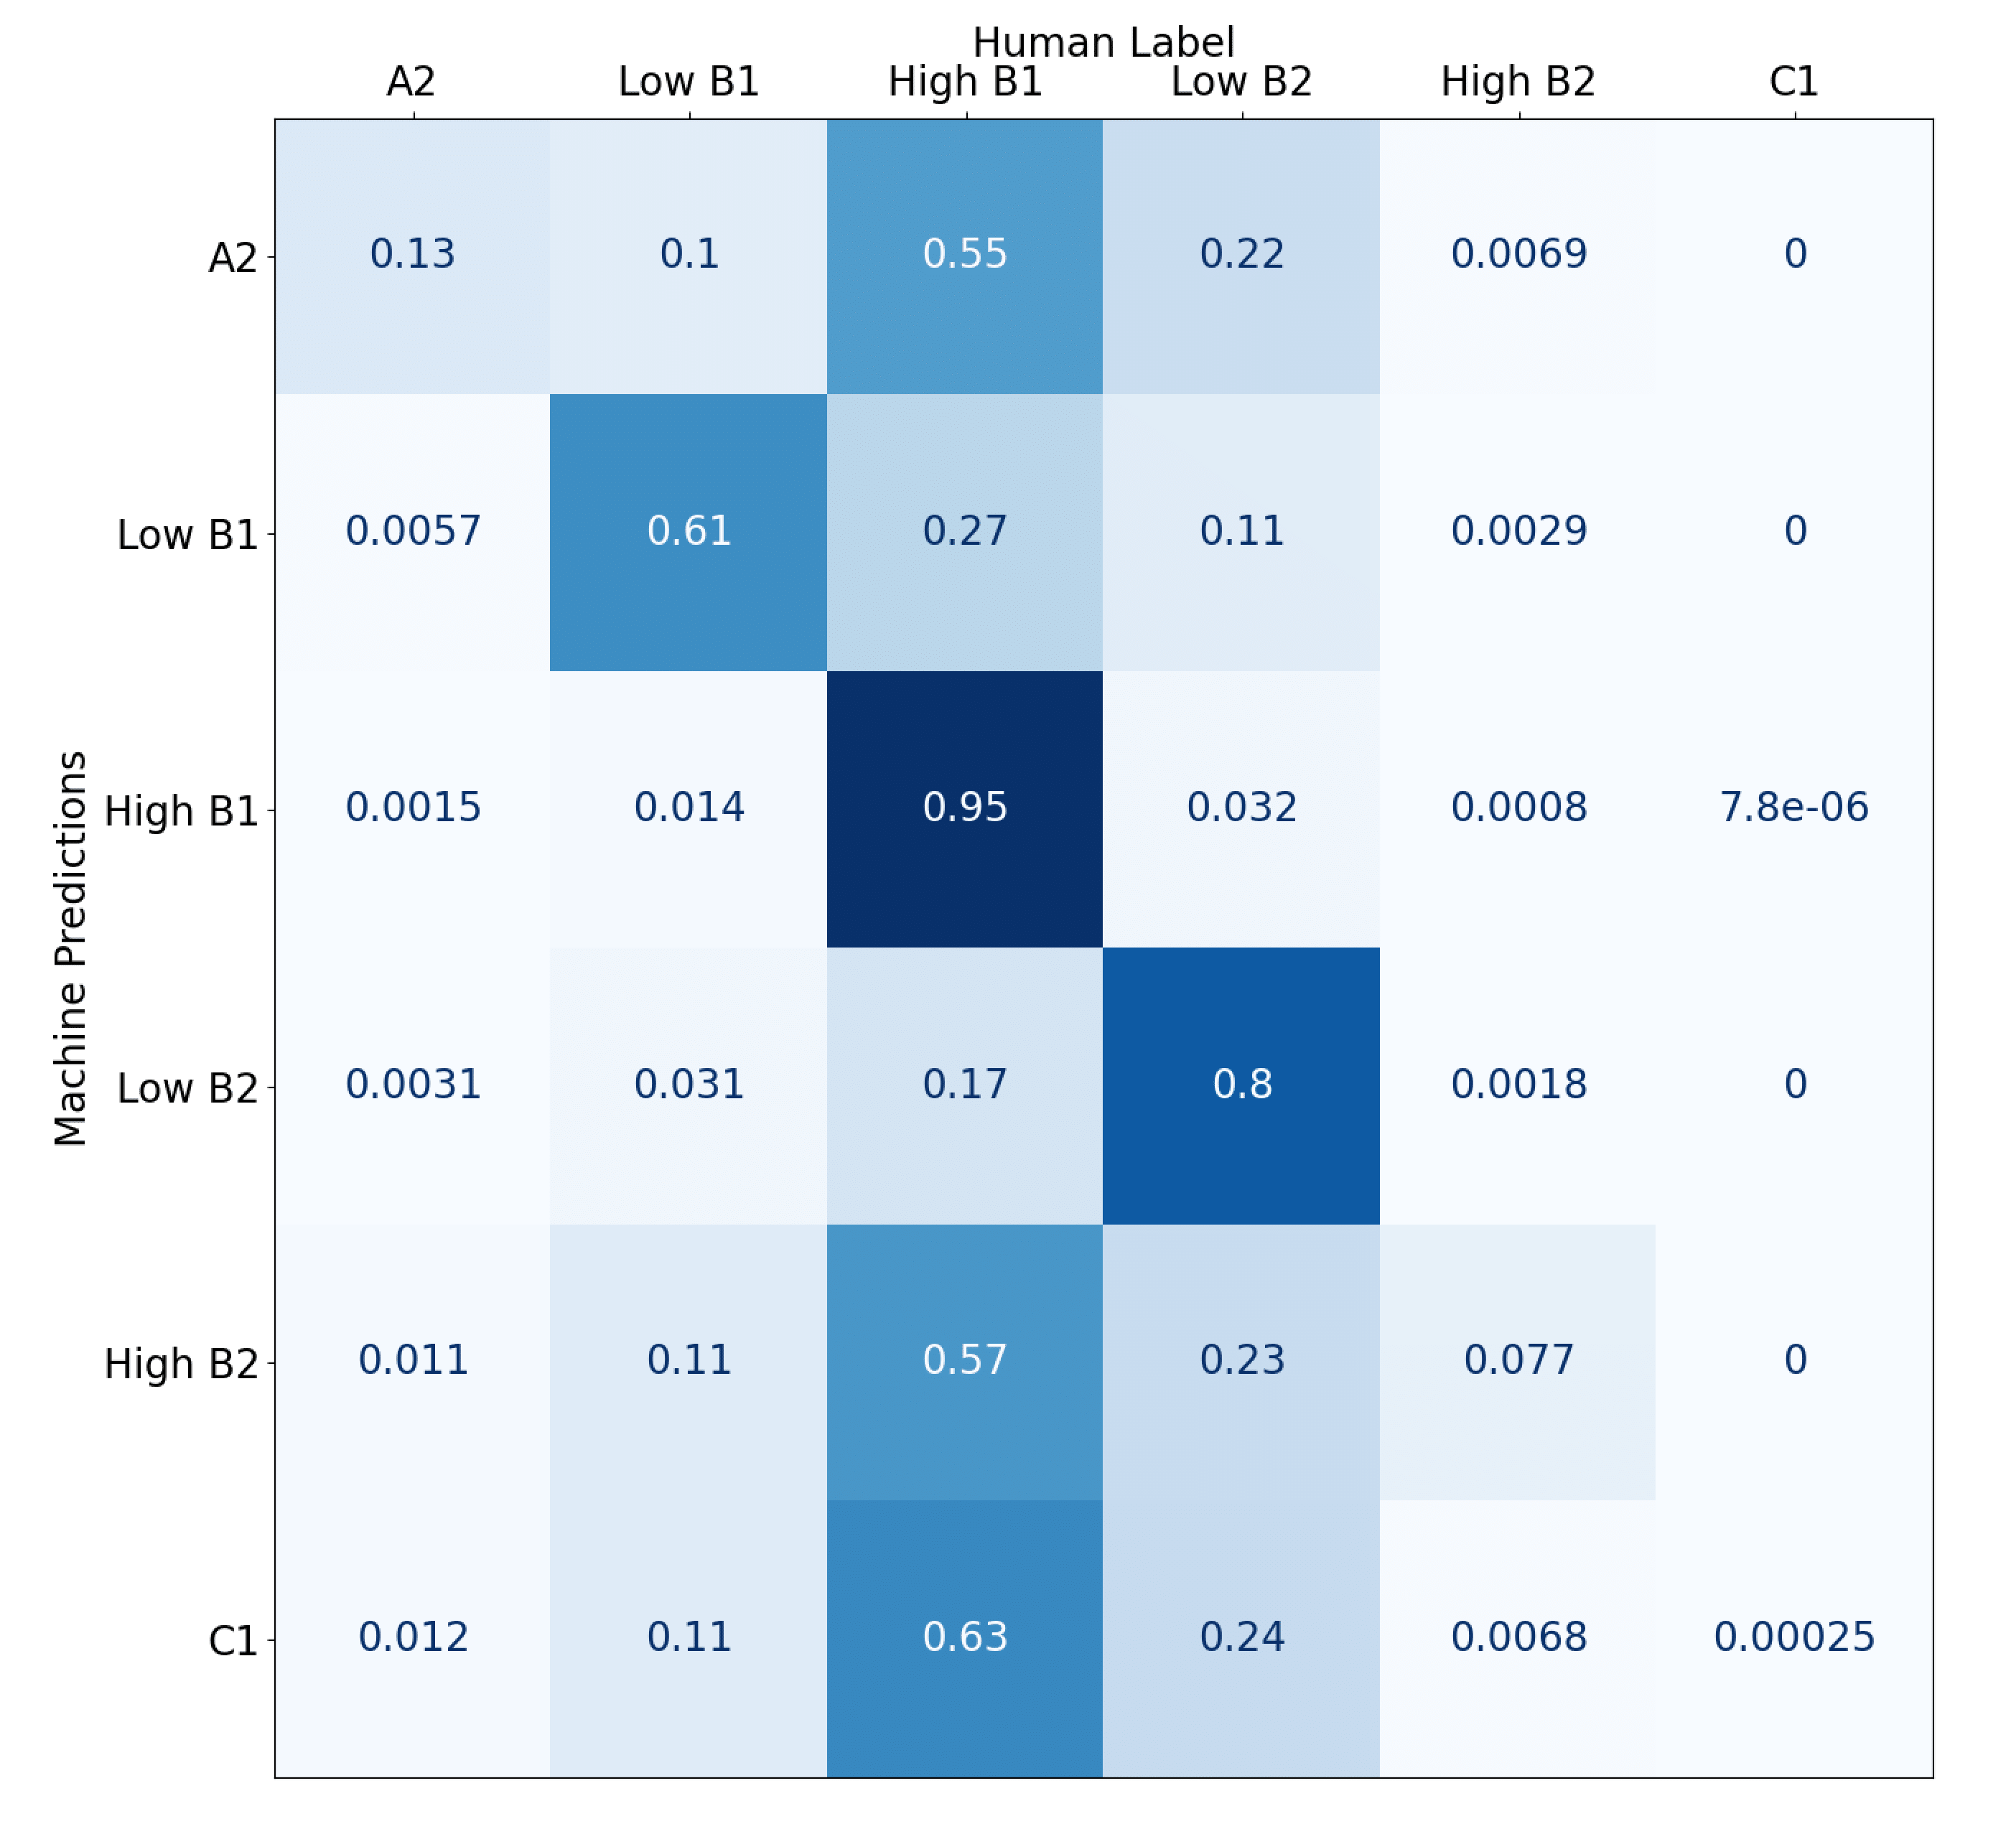
We compute a human-machine agreement matrix on historical data, which encodes the agreement of a human rater with the machine for each grade. The figure below shows the same for the 6 grades part of our dataset, from A2 (beginner) to C1 (advanced). Each entry indicates the probability of the class predicted by the machine aligning with the class labeled by the human. m(High B1)(High B1) = 0.95, which means that the machine is correct 95% of the time when it assigns the grade High B1. A very poor candidate for sampling which we ought to avoid.
 A human-machine agreement matrix, that is, a confusion matrix.
Uncertainty Sampling quantifies this concept and computes a value for each response, creating a probability distribution over which we can sample records more likely to be wrongly scored. To quantify the uncertainty of each class prediction, we make use of the Cross Entropy function. For e.g., the distribution associated with Low B1 in the matrix is [0.0057, 0.61, 0.27, 0.11, 0.0029, 0]. The ideal distribution that we want to see for Low B1 is [0, 1, 0, 0, 0, 0], where the machine predicts the class Low B1 with 100% accuracy. The Cross Entropy function quantifies the distance between these two distributions allowing us to focus our sampling on specific classes.
Reward Sampling
While Uncertainty Sampling makes use of the accuracy of the machine’s prediction of each class, Reward Sampling takes it a step further by also using the format of a language proficiency test. In a test, you are not scored on just one response. Your score is aggregated from multiple responses to compute a final proficiency. In our dataset from SLTI, test takers answer 6 questions, and their final score is calculated using all of these.
We can exploit this structure to further refine our sampling. Crucially, we do not care whether we are right on individual responses, only at the global grade. In addition to sampling records which are likely to be wrong, we sample records based on the reward that being right would generate, that is, an increase in accuracy at the global level.
Consider a scenario of two test takers with 4 responses each, where we can select one response to be graded by humans. Let us further assume that our test takers have answered at the A2 level and should be scored at the same.
X has achieved grades of [A2, A2, A2, Low B1] with a final grade of A2.
Y has achieved grades of [A2, A2, A2, C1] with a final grade of High B1.
The Low B1 grade, while wrong, is not wrong enough to change the final grade of X, but the C1 grade has affected Y’s grade and changed it to High B1. Reward Sampling would point us towards the C1 response, on account of its impact on the final grade of Y.
With that example, let’s bring out the math and formalize Reward Sampling, where the expected reward $E_R$ is calculated as:
$E_R(d) = \sum_{c \in C} p(c \, | \, m)*reward(d, c) \;\; \forall d \in D$
Where $d$ represents one record in the dataset $D$, $c$ and $m$ represent classes in the set of all classes $C, \; p(c \, | \, m)$ indicates the probability of the ground truth being class $c$ when machine has predicted class $m$, and the reward function is denoted as $reward$. The expected reward encodes the reward gained by the ground truth being $c$ when the machine has predicted $m$ weighted by the probability of the same, summed over every class $c$. $p(c \, | \, m)$ is looked up from the human-machine agreement matrix and the output of the reward function is weighted by this probability.
The reward function calculates the reward gained by swapping the predicted class with a different class. Taking the example above, in the case of X, changing the Low B1 grade to the correct grade of A2 has no impact on the final grade, which remains A2, hence incurring a reward of 0. On the other hand, in the case of Y, changing C1 to A2 would change the final grade to A2, incurring a reward of 2 (The final grade changes from High B1 -> Low B1 -> A2). Simply put, the reward is the absolute difference between the old grade and the new grade. In this manner, we calculate an expected reward for each response and further refine our targets for sampling.
Estimating with Guarantees
In high stakes testing scenarios like these, where language proficiency results are used in graduate admissions, job applications and more, it is critical to ensure that systems do not fail catastrophically. For this purpose, we propose a way to get estimates of performance with statistical guarantees.
In doing so, we make use of another (small) sample drawn for this purpose. Why another sample? The sample already drawn to be corrected are drawn on the likelihood of them being scored wrongly, making any estimates drawn from this sample very underconfident. Thus, we draw another sample for the purpose of estimation.
While we could use random sampling, the theme so far has been sampling efficiency :). Previous work has shown that sampling based on a model’s confidence of prediction can be leveraged to provide better estimates. When we create a 95% confidence interval over this sample and take the lower bound of the estimate, we provide a statistical guarantee that the metrics of the model will not fall below this estimate 95% of all runs. The confidence of the model’s prediction is proxied by $1-uncertainty$, which we already have from the human-machine agreement matrix. Thus, a secondary sample is drawn to provide a estimate with statistical guarantees.
 Putting all the pieces together
Results
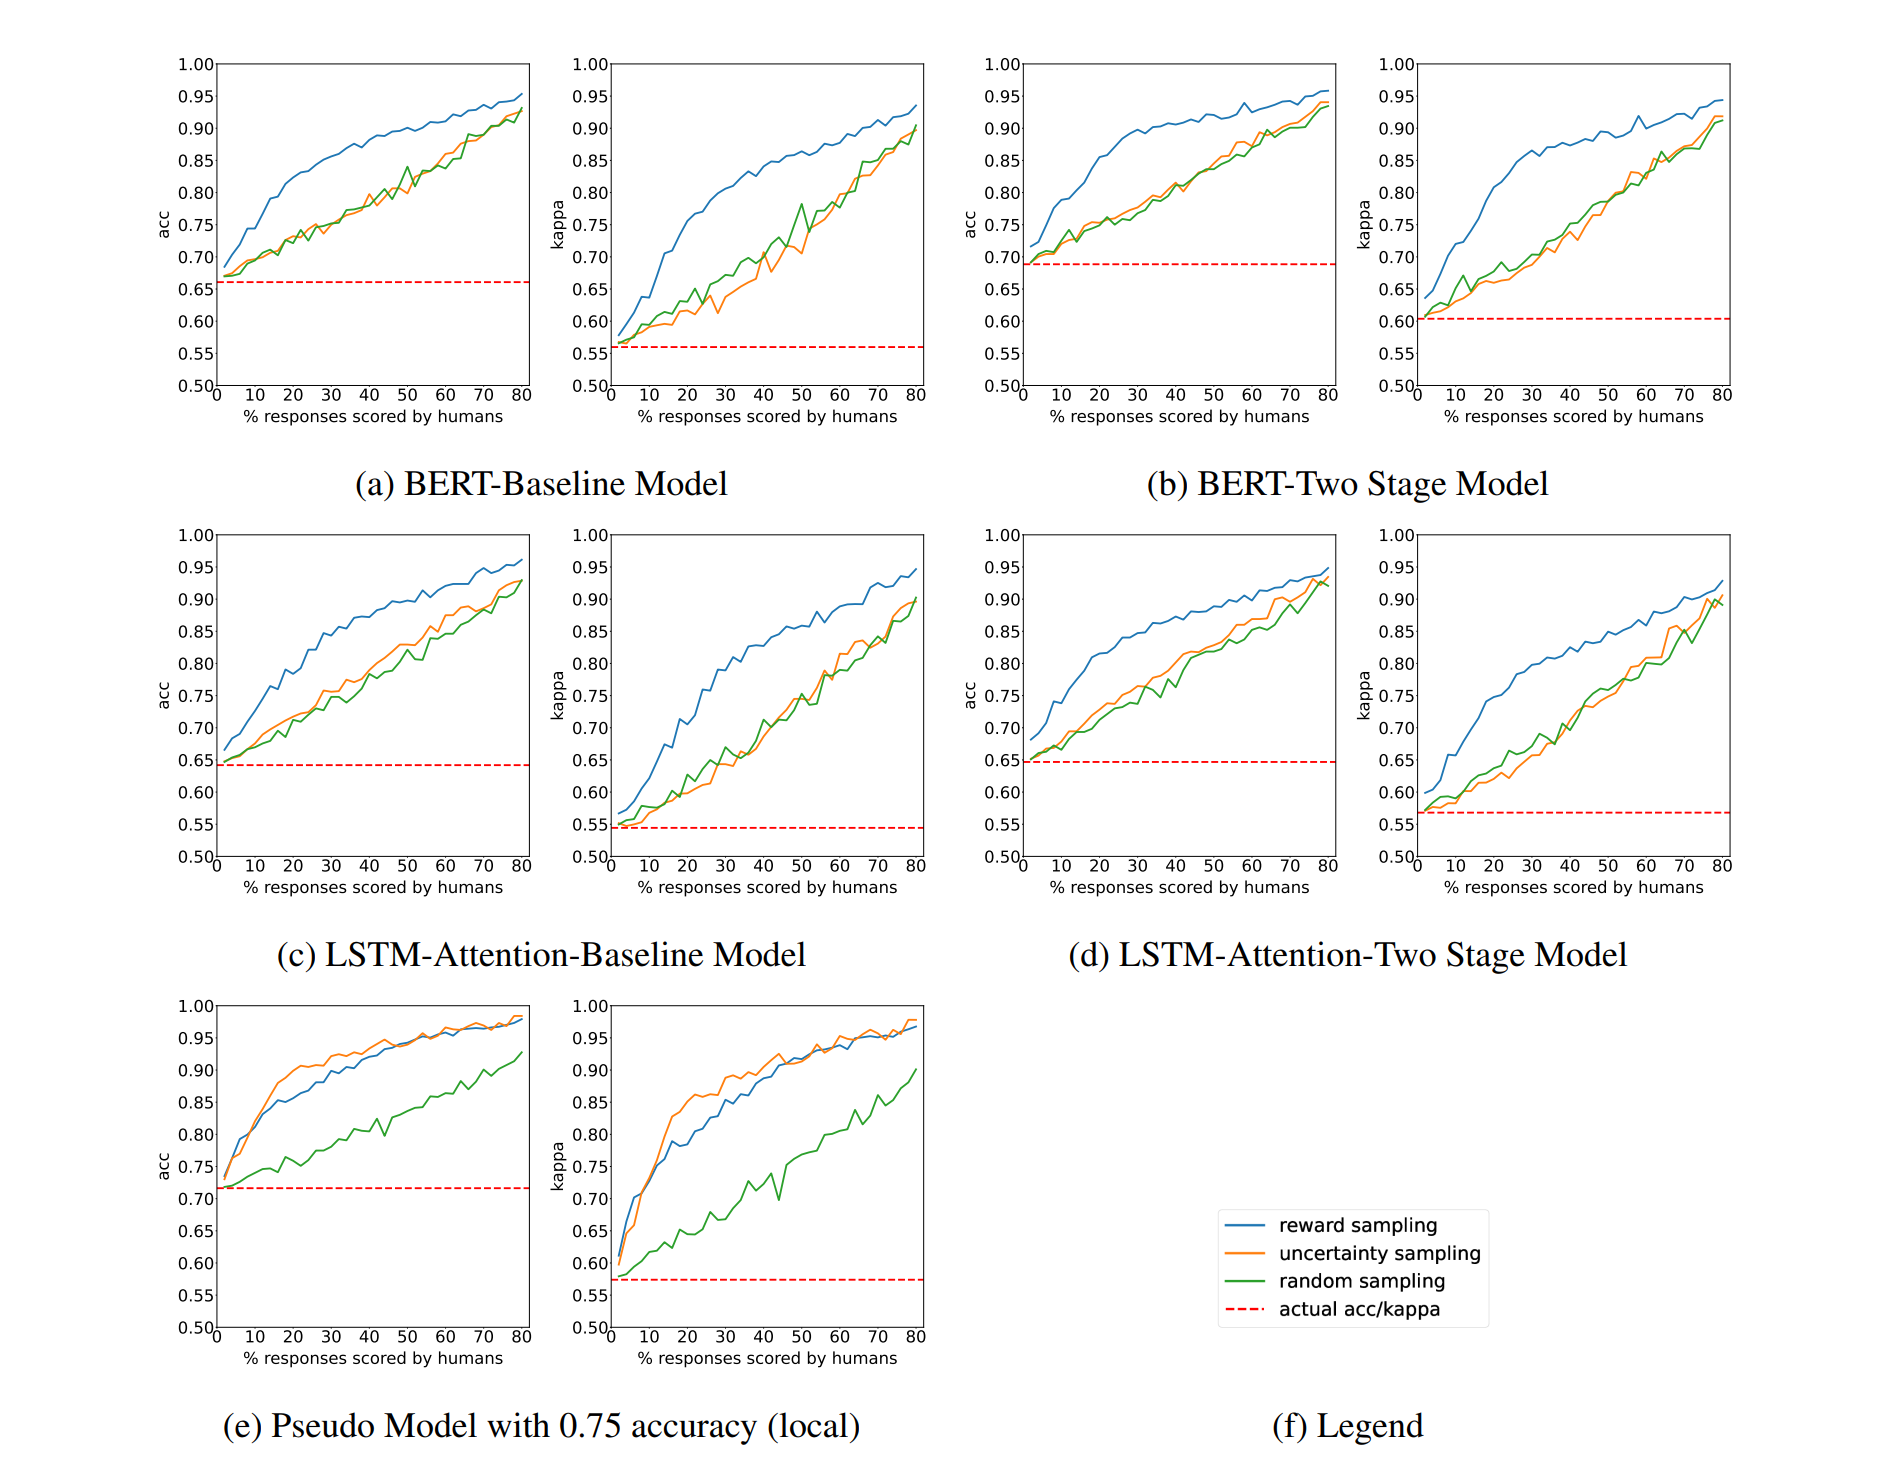
We tested our sampling methods across a number of models and varying sample sizes to see how accuracy and quadratic weighted kappa (QWK) change. (In the interest of brevity, full details about the model and dataset have been omitted. For that and to look at the pretty graphs in better resolution, have a look at the paper!)
 In each model, we show the change in accuracy (left) and quadratic weighted kappa (QWK) (right) after sampling with the sample size (human budget) shown on the x-axis. Reward sampling outperforms both uncertainty sampling and random sampling baseline in each model.
Our baselines, random and uncertainty sampling, perform fairly similar to each other whereas Reward Sampling outstrips them both. The relatively poor performance of Uncertainty Sampling indicates that taking into account the global context significantly aids the performance of the system. Astute readers will notice that Random Sampling and Uncertainty Sampling start closing the gap to Reward Sampling as the sample size increases. Intuitively this makes sense, with such a large sample size available, your sampling algorithm doesn’t need to be very good and is overshadowed by the sheer number of samples available. With a sample size of around 30% however, we see strong gains from Reward Sampling, showing promise for a real world deployment.
Looking forward, the straightforward path is developing even more sample efficient algorithms, to get the most bang for our buck, so to speak. Another possible research avenue where we can apply our algorithms is in test design. While right now test design involves linguistic validity assessment studies, it does not take into account the reliability of the final test built. Reliability of a test could be incorporated as another constraint easily through our modelling paradigm.
And that’s it! Feel free to contact me if you have any questions! ![]()
